
The blog · Demand Generation · From The Demand Compass · 7 min
What LinkedIn connection and reply rates should you expect?
Cold requests get accepted around 21 percent of the time. The same outreach into an audience that knows you or is in motion runs two to three times higher, with the copy barely changed.

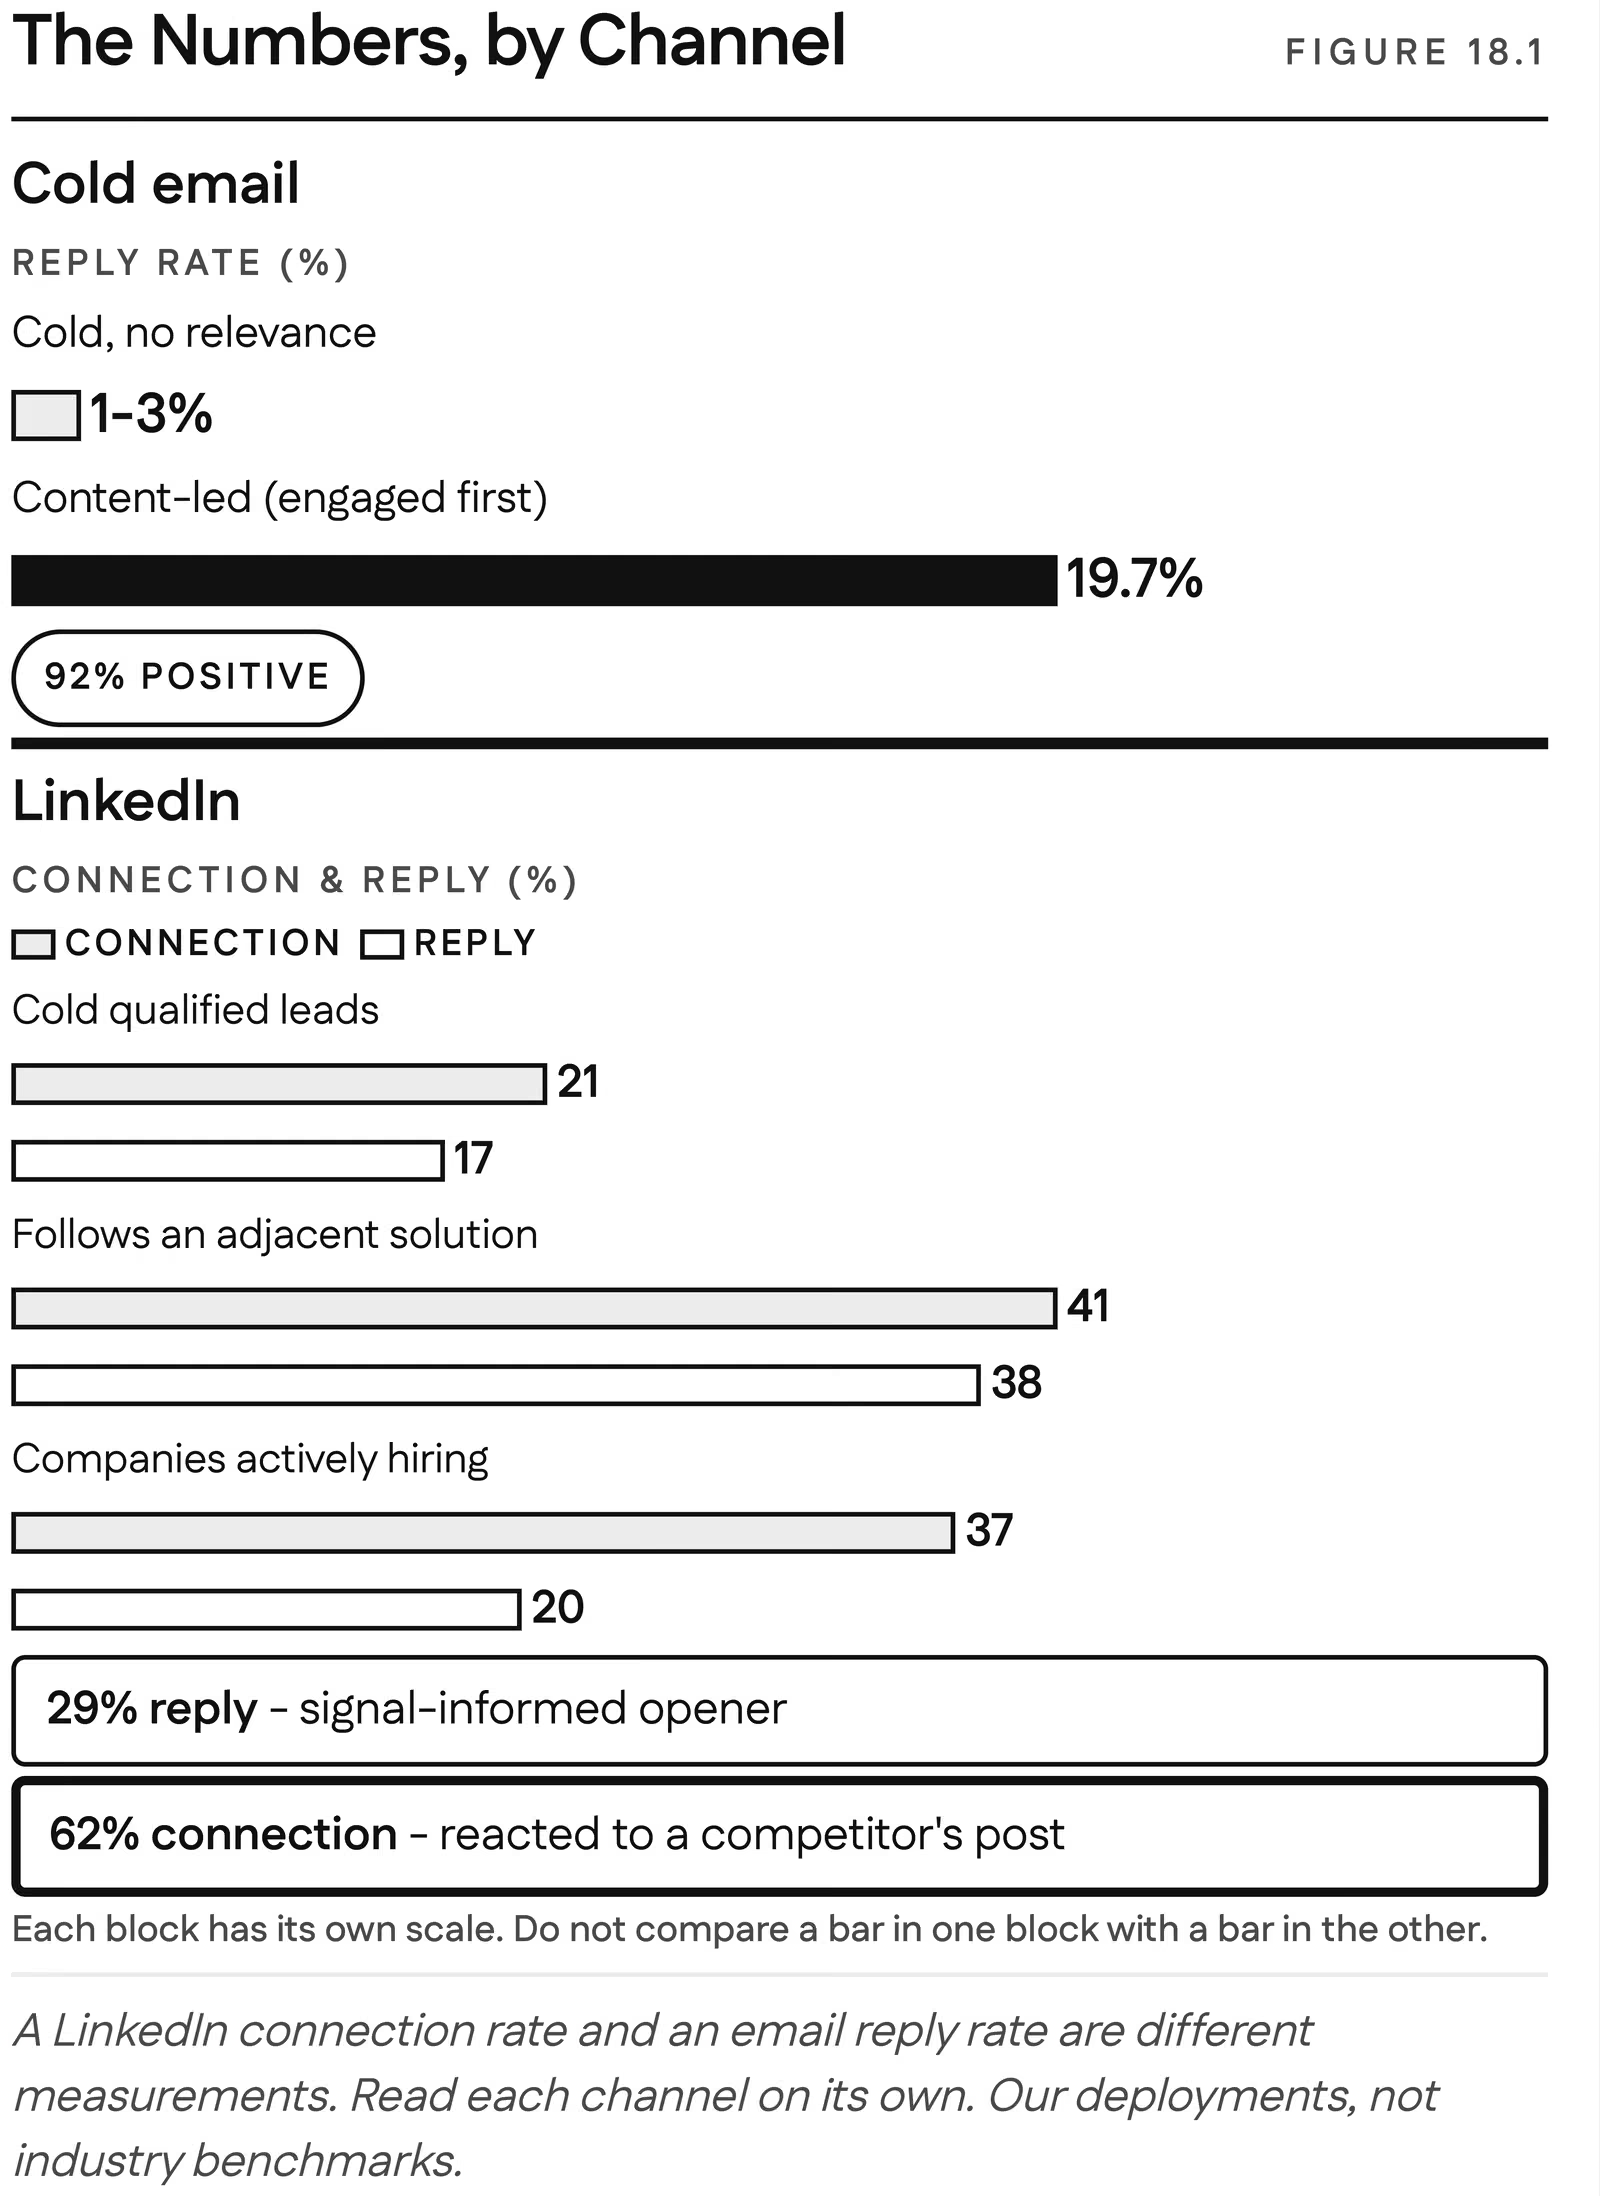
A cold LinkedIn connection request to a qualified lead gets accepted around 21 percent of the time and replied to around 17 percent, in our own deployments. The same outreach aimed at people who already know you, or who are visibly in motion, runs two to three times higher: 41 percent acceptance from followers of an adjacent solution, replies near 30 percent when the opener is built on a signal, and 62 percent acceptance from people who had just reacted to a competitor's posts. The copy barely changes between those numbers. What changes is who you reach and what they already know about you.
What is a normal cold connection rate on LinkedIn?
A cold connection request to a qualified lead, someone who fits the profile but has never heard of you, gets accepted about 21 percent of the time and replied to about 17 percent of the time in our deployments. That is the floor, and it is a healthier floor than cold email, where a send with no relevance behind it replies at one to three percent. LinkedIn starts higher because a connection request costs the recipient almost nothing and carries a face and a title with it. These are our numbers from the markets we work in, not an industry benchmark, so read them as the shape of the thing rather than a law.
Read the reply numbers one channel at a time, because mixing LinkedIn and email is how a deck starts lying. A connection-acceptance rate and an email reply rate are different measurements of different behaviors, and a blended "response rate" hides which channel is doing the work.
How much does a warmer audience change the rates?
Aim the same outreach at people who already know something about your category and both rates jump, in the same shape every time. People who follow an adjacent solution accepted our requests at 41 percent and replied at 38. A list of companies actively hiring for the problem we solve replied at 20 percent against a connection rate in the high thirties. An opener personalized to the problem behind a signal pulled replies near 30 percent. And a campaign aimed at people who had just reacted to a competitor's posts, an audience that is both aware of the category and visibly in motion, accepted connections at 62 percent.
Within a channel you can multiply your response several times over without writing better copy.
Sit with how large those gaps are. Within a channel you can multiply your response several times over without writing better copy. What changes is who you reach and what they already know. On email the lift has the same shape and a bigger multiple: a send into an audience that had engaged with our content first replied at almost twenty percent, with more than nine in ten of those replies positive, against one to three percent cold. Same channel, barely different copy, close to ten times the result.
| Audience | Connection accepted | Replied |
|---|---|---|
| Cold, qualified lead | 21% | 17% |
| Hiring for the problem we solve | High 30s | 20% |
| Follows an adjacent solution | 41% | 38% |
| Opener built on a signal | near 30% | |
| Reacted to a competitor's post | 62% |
Why do the rates move so much between audiences?
The rates move because the two things that decide whether a stranger answers, whether they know you and whether something is happening at their company, are exactly the two axes the Demand Compass reads. Brand awareness is whether the account knows and trusts you; readiness is whether there is momentum inside the account right now. A follower of an adjacent solution has awareness of the category. A company hiring for your problem has readiness. Someone reacting to a competitor's post this week has both, which is why that audience produced the highest acceptance rate we have measured.
And it compounds. Several signals on one account tell you it is unmistakably in motion, and outreach into motion performs at a level cold outreach never touches. The rate you get is less a property of your message than of the position of the account you sent it to.
What happens after the reply?
Reply rate is the doorway, not the house. It tells you whether the first message earned a response and almost nothing about whether you built pipeline, and a skeptical revenue leader is right to push past it. The numbers below are composite ranges from our deployment patterns, not benchmarks, and every one moves with the market you sell into.
Sales acceptance rate is the quietest number and the most honest one: the share of routed accounts a rep actually works rather than rejects. A bare MQL, a form fill with a title attached, gets worked maybe a third to half the time before reps learn to ignore the queue. An auditable, signal-led score, where the rep can see why the account surfaced, gets accepted far more often, frequently north of 70 to 80 percent once the team has watched it pay off a few times. If acceptance is low, the score is wrong or the explanation is missing.
Meetings booked from a signal turn into real opportunities at a higher rate than meetings forced through persistence, because you arrived when something was actually happening. The lift is real but narrower than people expect, a handful of points to maybe double, and the dirtier the signal, the closer it drifts back to your baseline. Deals where the brand did its work first, and where the outreach landed inside the window, have moved through the cycle roughly 25 to 30 percent faster than the cold-sourced equivalent in the same segment.
Marcos has a habit that shows how far this reaches. When we book a meeting from a cold-sourced account, we stack extra reminders on it, because a cold-sourced prospect is measurably less likely to show up than one who came through LinkedIn already knowing us. The source predicts the behavior all the way to the calendar.
How do you measure your own LinkedIn rates honestly?
Measure by cohort, and keep a holdout. Split your outreach by how much signal was behind each touch, none, one, several, and read the acceptance and reply rate of each group separately. The gap between your cold tier and your signal tier is the single most persuasive number you can bring to the meeting where you ask to build any of this, and you almost certainly already have the data.
Then protect a 5 to 10 percent randomized control group. Without it, you score an account high, work it hard because the score told you to, it closes, and you take credit for the score. That is a self-fulfilling prophecy, not a measurement. A small randomized slice of high-scoring accounts held back or routed normally is the only clean read on what a score is worth, and the day someone decides the holdout costs too much pipeline is the day you lose the ability to prove the system works.
Related questions
Is a 20 percent LinkedIn acceptance rate good?
For a cold request to a qualified lead, it is normal: our cold cohort runs around 21 percent. It becomes a problem only if your warm cohorts are not doing better, because that means the list is not sorted by what the accounts already know.
Should I mention the signal I saw in the connection request?
No. Let the signal tell you which problem to open on and lead with the problem. Naming the signal makes a stranger sound like they have been watching, and people pull back from feeling monitored. The opener built this way is the one that ran near 30 percent.
Why is my email reply rate so much lower than my LinkedIn rate?
They measure different behaviors. A connection request costs the recipient almost nothing; a reply to an email is work. Cold email replies at one to three percent for us, cold LinkedIn requests are accepted at 21 percent. Compare each channel against its own cold baseline, never against the other channel.
Do these rates hold outside the markets you work in?
The figures do not travel; the mechanism does. Reply rates depend on your market, conversion lift on your product, and the pipeline multiple on where you started. Expect the shape, warm outperforming cold by a multiple, and measure your own numbers.